Internet Computer (ICP) Price Prediction – May 9
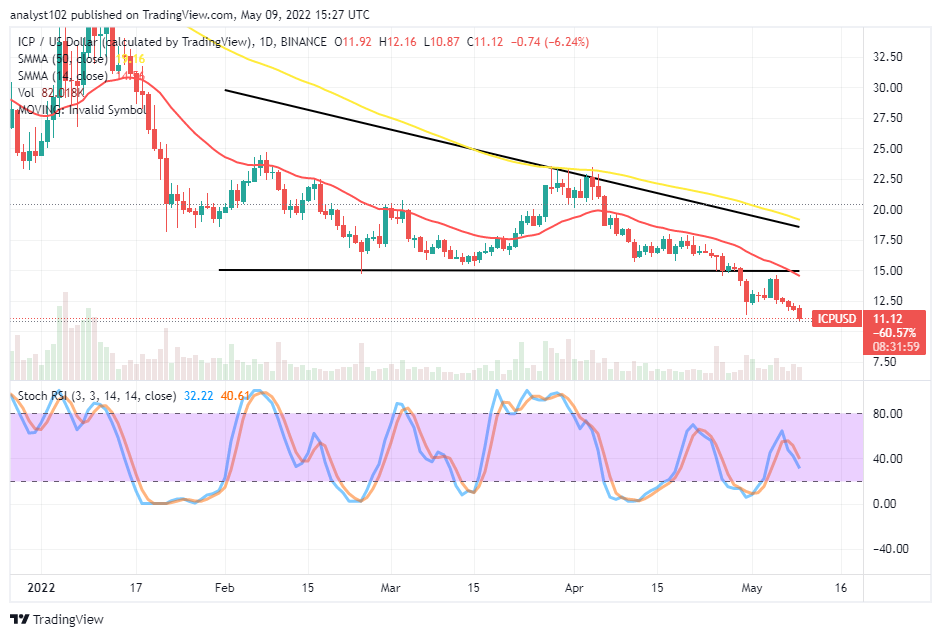
Variant downing processes have prevailed in the ICP/USD market activities over several sessions, showcasing that the base trading instrument has been under free fall. Presently, the crypto’s price is trading around $11 at a negative percentage of 6.24.
Internet Computer (ICP) Market
Key Levels:
Resistance levels: $15, $17.50, $20
Support levels: $10, $7.50, $5
ICP/USD – Daily Chart
The daily chart reveals the ICP market operation is under free fall, trading against the valuation of the US trading currency. The 50-day SMA indicator is above the 14-day SMA indicator. A bullish candlestick showing an upward momentum signal was countered by a bearish candlestick on the following day’s session to nudge the trend back into a downward motion extensively. The Stochastic Oscillators have crossed southbound from around the range of 70 to a slight position past the 40 range. And they are still pointing toward the downside.
Will the ICP be for long under free fall trading against the US currency?
ICP market’s value may be under free fall-offs for the long term, trading against the worth of the US Dollar. It requires a heavy re-appearance on the part of bulls to bring the current situation back to the upside at this point of the transaction spot. Long-position takers may be on the lookout for a reliable rebounding attempt when the price makes a quick touch around the $10 support level to launch a buying order.
On the downside of the technical analysis, the ICP/USD market short-position takers may have to allow some degrees of pull-ups that are allowing timely reversal motion to exert a sell order in the process. The emergence of a bullish candlestick spanning from a lower spot around $12.50 upward against the $15 resistance level will likely push back the market to observe some ups during the days that will follow.
ICP/BTC Price Analysis
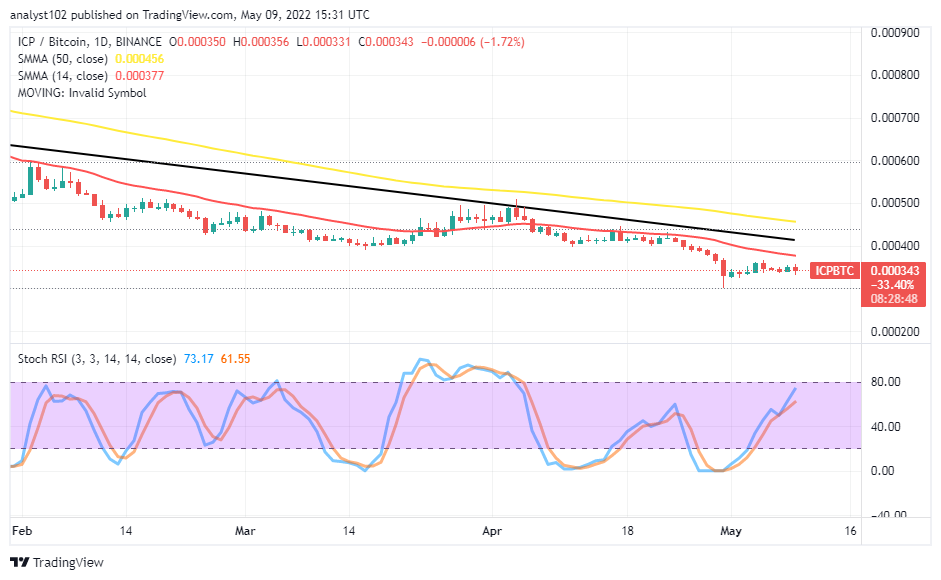
Internet Computer is trending downward slowly and steadily against Bitcoin. In other words, the cryptocurrency pair market is under free fall underneath the SMA trend lines. The 14-day SMA indicator is below the 50-day SMA indicator. The Stochastic Oscillators have placed northbound from the oversold region against variant range points closer to the 80 range. The present arrangement pattern of the candlesticks suggests there can still be more falling moments
Looking to buy or trade Internet Computer (ICP) now? Invest at eToro!

68% of retail investor accounts lose money when trading CFDs with this provider.
Read more:


