• About
  • Landing Page
  • Buy JNews
Newsletter
Impact Crypto News
Advertisement
  • Home
  • DeFi News
  • EVM News
    • Avalanche Network
    • Ethereum
    • Fantom Opera Chain
    • Harmony Chain
    • Huobi Eco Chain
    • Polkadot Chain
    • Polygon Chain
  • NFT News
  • Altcoin News
  • Crypto News
    • Crypto Regulation News
    • Bitcoin
    • Blockchain
    • Crypto Exchanges
    • Crypto Mining
    • Metaverse
    • Scam News
    • Web 3.0
No Result
View All Result
Impact Crypto News
No Result
View All Result
Home Crypto News Bitcoin

Ethereum Keeps Sliding Down, Will The Support Line of $1,100 Break?

IMPACTCRYPTO by IMPACTCRYPTO
June 30, 2022
in Bitcoin
57 1
0
Ethereum Keeps Sliding Down, Will The Support Line of ,100 Break?
189
SHARES
1.5k
VIEWS
Share on FacebookShare on Twitter


Ethereum continued on a bearish path as the coin has now found support level at $1,100. Over the last two days the coin surged and touched the $1,200 mark but shortly after that, it witnessed a pullback on the chart. Ethereum’s strong resistance currently stood at $1,300.

The technical perspective of the coin has also remained bearish. Over the last 24 hours, ETH lost 9% of its value and invalidated most gains it secured in the past one week. After the bulls could not manage to move past the $1,300 price ceiling, the coin has slipped down.

ETH has depicted a consolidated price range with price of the asset sandwiched between $1,280 and $1,110, respectively. If Ethereum doesn’t rise and break past the $1,300, price could dip and fall below the $1,000 mark. Buying strength also faded as price of the coin kept falling on the chart. The global cryptocurrency market cap today is at $937 Billion with a fall of 5.5% in the last 24 hours.

Ethereum Price Analysis: One Day Chart

Ethereum
Ethereum was priced at $1,111 on the one day chart | Source: ETHUSD on TradingView

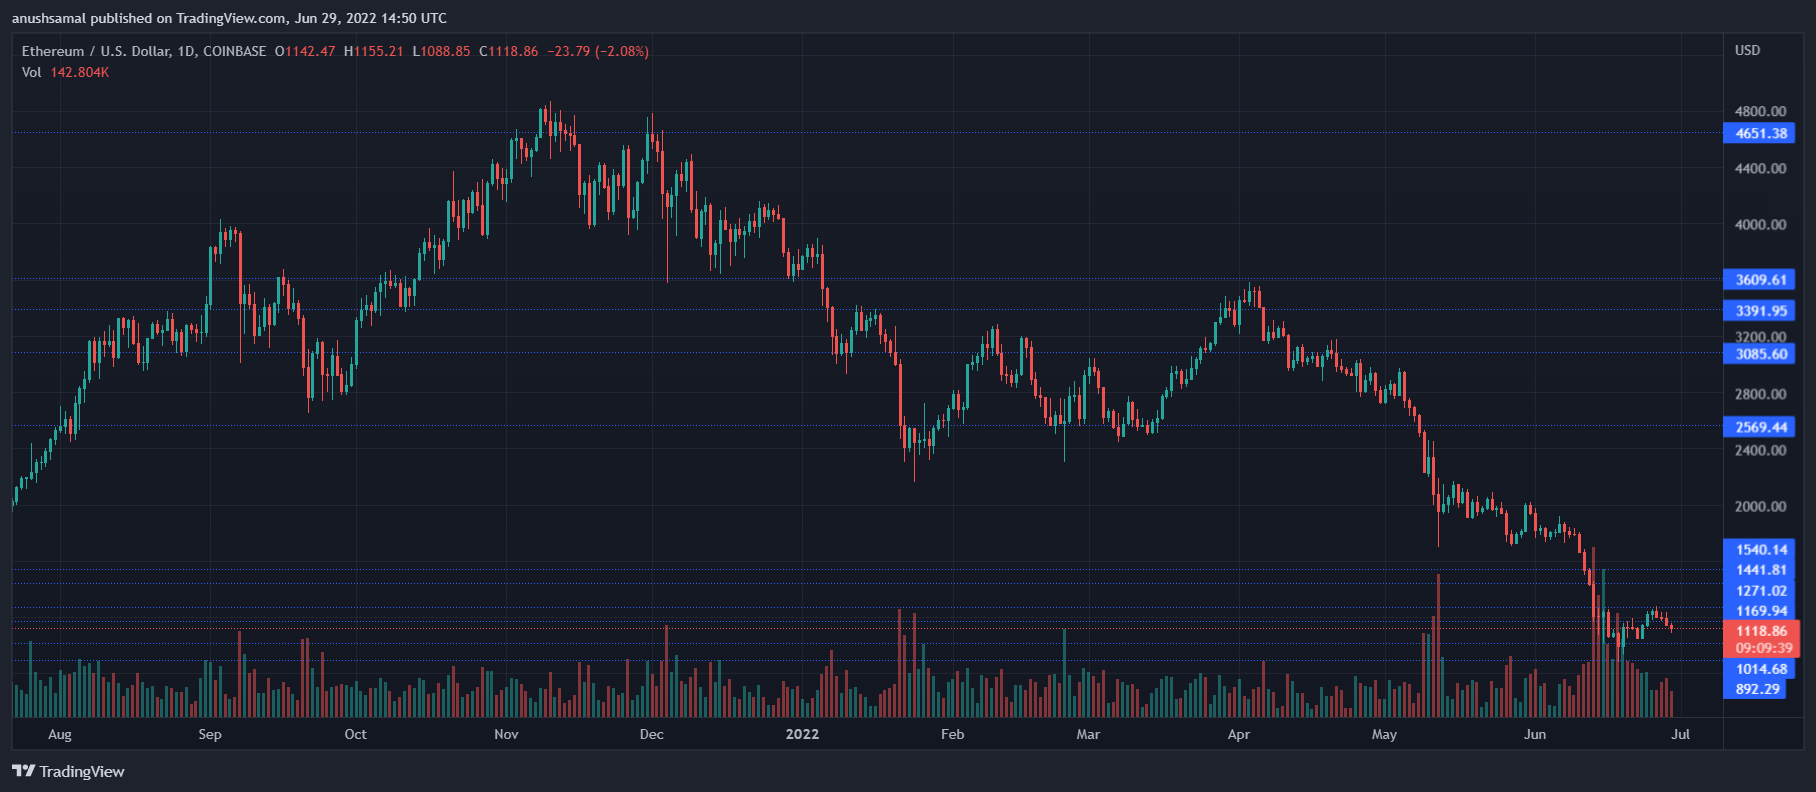
ETH was trading for $1,111 at the time of writing. Immediate support for the coin stood at $1,000, but if ETH starts to fall then the coin can trade at the $900 price level. Immediate overhead resistance stood at $1,200 and then at $1,300.

The last time the altcoin hovered around this price region was in the month of January 2021. If Ethereum falls to $900, it would mark a new low for the coin in the year 2022. If price of the altcoin manages to jump to $1,300 and trades above that level for significantly long, then rally to $1,700 could be possible.

Volume of Ethereum traded fell on the 24 hour chart which meant that buying strength decreased. The trading volume bar was red indicating bearishness.

Technical Analysis

Ethereum
Ethereum displayed fall in buying pressure on the one day chart | Source: ETHUSD on TradingView

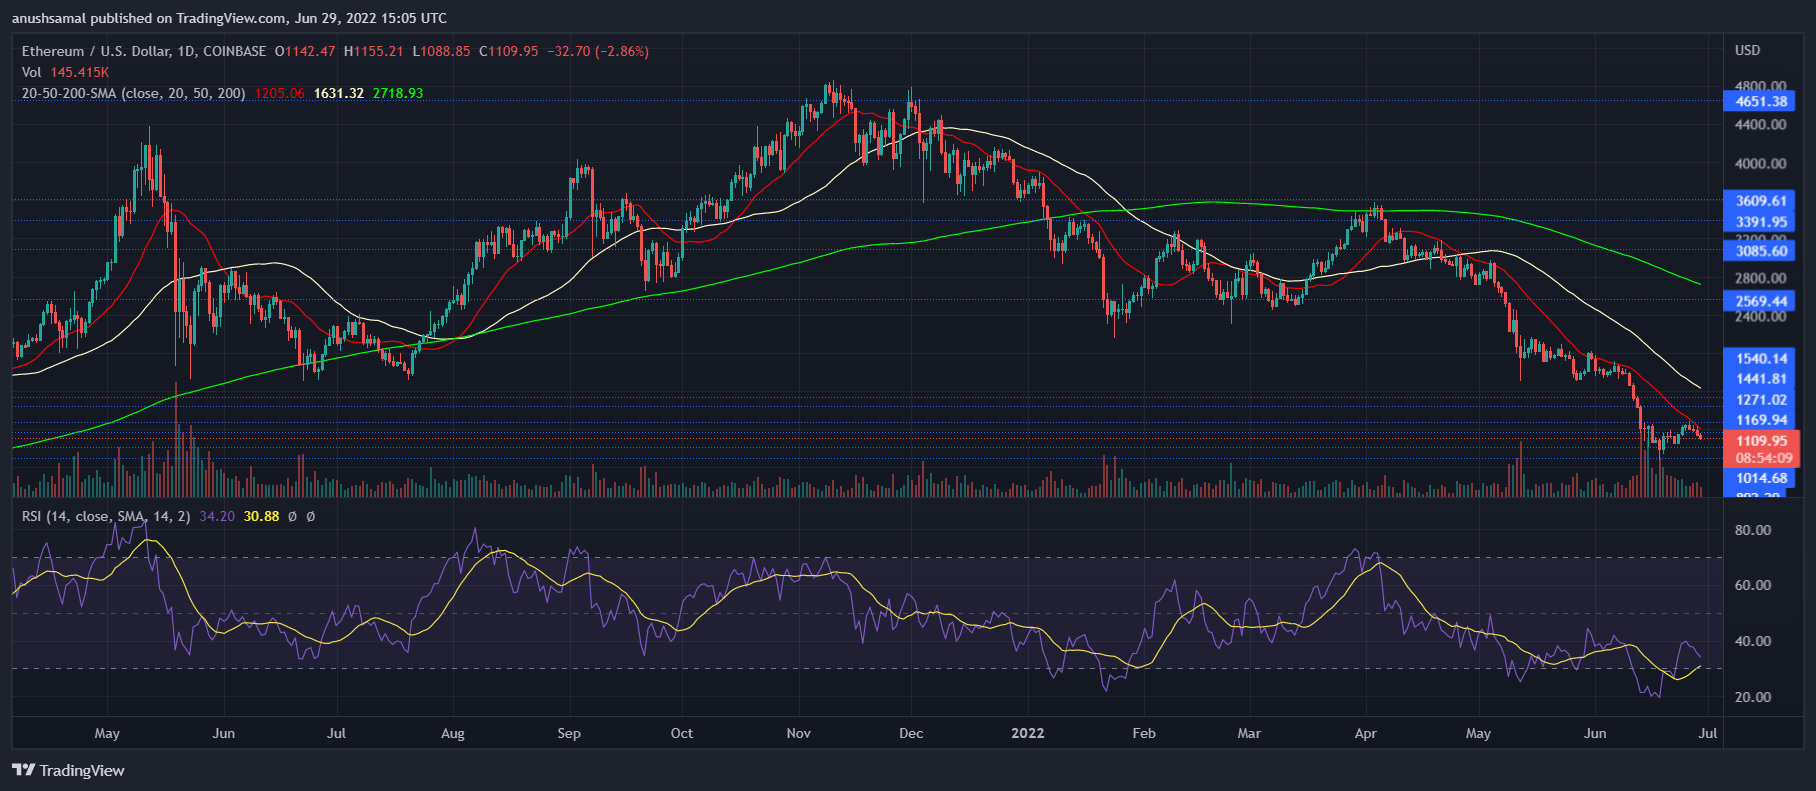
ETH was oversold over the last 48 hours, but the coin recovered and moved above the oversold zone. Despite this recovery Ethereum’s buying pressure remained extremely low on the chart. The Relative Strength Index noted a downtick and was nearing the oversold mark again.

Consistent downfall in demand can bring Ethereum to touch the $900 level over the next trading sessions. On the 20-SMA, the coin was seen below the 20-SMA line. A reading below the 20-SMA line means that the sellers were driving the price momentum in the market.

Related Reading | Why Ethereum Could Trade At $500 If These Conditions Are Met

Ethereum
Ethereum flashed buy signal on the one day chart | Source: ETHUSD on TradingView

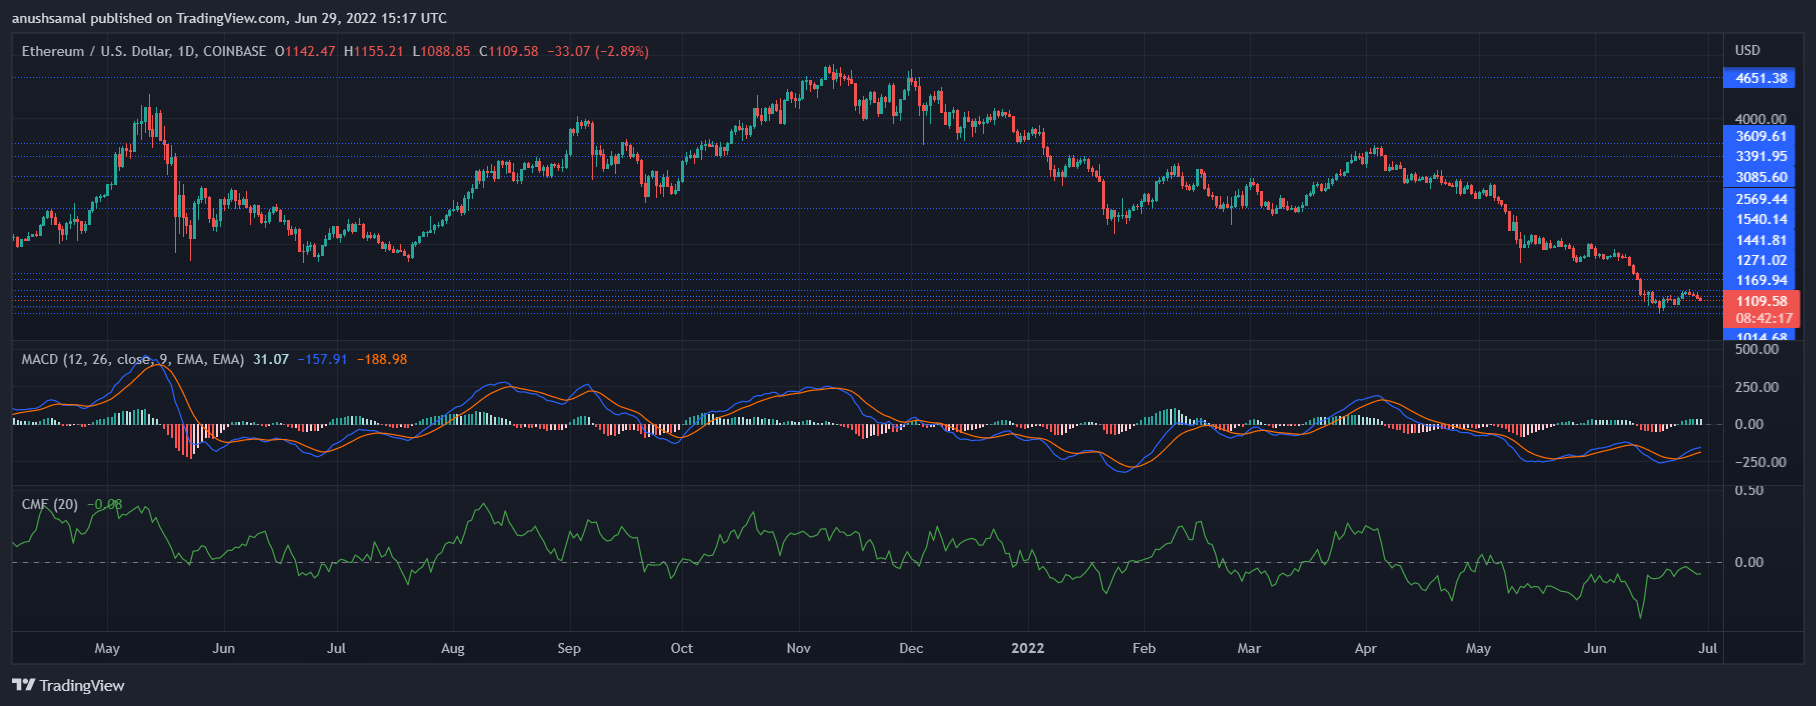
ETH noted a fall in buying strength despite that the coin flashed buy signal son the one day chart. Moving Average Convergence Divergence depicts the price momentum. It displayed a bullish crossover and flashed green signal bars which are buy signals for the coin.

The current price level could potentially turn into a demand zone for the king altcoin. Chaikin Money Flow demonstrated capital inflows and outflows on the chart. CMF was below the the half-line which meant that capital inflows were lesser than capital outflows signifying bearishness.

Suggested Reading | Ethereum Needs To Breach This Level To Sustain Bullish Pace

Featured image UnSplash, chart from TradingView.com


Source link

Related articles

Here Are The Reasons Why XRP’s Technical Structure Favors Upside Than Down Over Next Six Months

Here Are The Reasons Why XRP’s Technical Structure Favors Upside Than Down Over Next Six Months

December 14, 2025
Sangha Energizes 20 MW Texas Solar Bitcoin Mine Amid Record-Low Hashprice Pressure

Sangha Energizes 20 MW Texas Solar Bitcoin Mine Amid Record-Low Hashprice Pressure

December 14, 2025
Tags: bitcoin newsbreakcrypto analysiscrypto newsEthereumEthoz EdgeLatest bitcoin newslatest crypto newsLineSlidingSupport
Share76Tweet47

Related Posts

Here Are The Reasons Why XRP’s Technical Structure Favors Upside Than Down Over Next Six Months

Here Are The Reasons Why XRP’s Technical Structure Favors Upside Than Down Over Next Six Months

by IMPACTCRYPTO
December 14, 2025
0

XRP’s recent pullback to $2 has not changed the broader technical picture, according to a new analysis shared on X...

Sangha Energizes 20 MW Texas Solar Bitcoin Mine Amid Record-Low Hashprice Pressure

Sangha Energizes 20 MW Texas Solar Bitcoin Mine Amid Record-Low Hashprice Pressure

by IMPACTCRYPTO
December 14, 2025
0

Sangha Renewables has energized a 20-megawatt bitcoin mining facility in West Texas, marking the company’s latest effort to pair renewable...

Bitcoin To Retest ,000 Mark In Coming Days

Bitcoin To Retest $85,000 Mark In Coming Days

by IMPACTCRYPTO
December 14, 2025
0

Trusted Editorial content, reviewed by leading industry experts and seasoned editors. Ad Disclosure Amid a steady price rebound in the...

Bitcoin Macro Retracement Meets Mid-Range Battle

Bitcoin Macro Retracement Meets Mid-Range Battle

by IMPACTCRYPTO
December 13, 2025
0

Bitcoin is facing a critical juncture as its macro retracement converges with a tight mid-range battle between $86,000 and $100,000....

What is a Bitcoin ATM? How to Buy and Sell BTC with Cash

What is a Bitcoin ATM? How to Buy and Sell BTC with Cash

by IMPACTCRYPTO
December 13, 2025
0

Last Updated: Dec. 13, 2025 A Bitcoin ATM (sometimes called a BTM) is a physical kiosk that allows you to...

Load More

Welcome Back!

Login to your account below

Forgotten Password?

Retrieve your password

Please enter your username or email address to reset your password.

Log In
Please enter CoinGecko Free Api Key to get this plugin works.
No Result
View All Result
  • Home
  • DeFi News
  • EVM News
    • Avalanche Network
    • Ethereum
    • Fantom Opera Chain
    • Harmony Chain
    • Huobi Eco Chain
    • Polkadot Chain
    • Polygon Chain
  • NFT News
  • Altcoin News
  • Crypto News
    • Crypto Regulation News
    • Bitcoin
    • Blockchain
    • Crypto Exchanges
    • Crypto Mining
    • Metaverse
    • Scam News
    • Web 3.0

© 2018 JNews by Jegtheme.