• About
  • Landing Page
  • Buy JNews
Newsletter
Impact Crypto News
Advertisement
  • Home
  • DeFi News
  • EVM News
    • Avalanche Network
    • Ethereum
    • Fantom Opera Chain
    • Harmony Chain
    • Huobi Eco Chain
    • Polkadot Chain
    • Polygon Chain
  • NFT News
  • Altcoin News
  • Crypto News
    • Crypto Regulation News
    • Bitcoin
    • Blockchain
    • Crypto Exchanges
    • Crypto Mining
    • Metaverse
    • Scam News
    • Web 3.0
No Result
View All Result
Impact Crypto News
No Result
View All Result
Home Crypto News Bitcoin

Extremely Bullish 88-Day Structure Appears On Bitcoin Price Chart After Hitting $105,000 ATH

IMPACTCRYPTO by IMPACTCRYPTO
December 16, 2024
in Bitcoin
56 2
0
Extremely Bullish 88-Day Structure Appears On Bitcoin Price Chart After Hitting 5,000 ATH
189
SHARES
1.5k
VIEWS
Share on FacebookShare on Twitter


Este artículo también está disponible en español.

The Bitcoin price has continued its foray above the $100,000 threshold and is currently trading around new all-time highs. Following its recent surge to an all-time high (ATH) above $106,000, the Bitcoin price has played out an interesting pattern on the 1-day candlestick timeframe, which points to an extremely bullish outlook for the leading cryptocurrency.

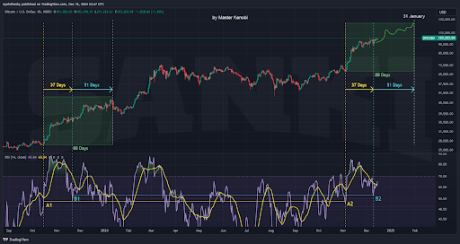
Notably, Master Kenobi, a popular crypto analyst on X, revealed an extremely bullish 88-day pattern on the Bitcoin price chart, drawing parallels to a similar pattern from late 2023.

88-Day Pattern Resembles Historical Symmetry On Bitcoin Price Chart

Master Kenobi’s analysis begins with the identification of an 88-day structure that bears a striking resemblance to Bitcoin’s price movements in Q4 2023, just before the current bull market phase began. Taking to social media platform X, the analyst noted that the initial 37 days of the current pattern since November 2024 mimic a similar hidden distribution phase observed last year. Furthermore, both the price action and the daily Relative Strength Index (RSI) indicator align closely with the previous cycle. 

Related Reading

To visualize this, he connected critical points A1 to A2 and B1 to B2 on the relative strength index, which highlighted the symmetrical nature of the formations.

According to Master Kenobi, the symmetry between these sequences suggests that Bitcoin’s ongoing trajectory could mirror its past, particularly in the next 51 days. While the analyst emphasizes that this observation is not a precise prediction, he believes it offers a framework for understanding Bitcoin’s behavior based on past behavior and the current structure.

Bitcoin price
Source: X

Projection Points To $124,300 By Early 2025

Bitcoin and other cryptocurrencies have been known to repeat their previous price performance from time to time. By analyzing historical price playouts and current patterns, analysts and traders are provided with a context of what to expect. Expanding on his analysis, Master Kenobi ventured into speculative territory by sketching a predicted price path for Bitcoin. 

Related Reading

The analyst speculated that the next 51-day sequence could follow a similar trajectory to the past 51 days in late 2023, culminating in a price of $124,300 by January 31, 2025. 

At the time of writing, Bitcoin is trading at $105,000, having recently reached an intraday high and all-time high of $106,352 in the past 24 hours, according to CoinGecko. The leading cryptocurrency is already up 12% this month, and reaching the projected price target of $124,300 would translate to a further 18% increase. Whether Bitcoin repeats its price pattern in late 2023 remains to be seen, but current price action and crypto market sentiment suggest that the Bitcoin price has a lot of room to run in 2025.

Bitcoin price chart from Tradingview.com
BTC price trending close to new ATH | Source: BTCUSD on Tradingview.com

Featured image created with Dall.E, chart from Tradingview.com


Source link

Related articles

Here Are The Reasons Why XRP’s Technical Structure Favors Upside Than Down Over Next Six Months

Here Are The Reasons Why XRP’s Technical Structure Favors Upside Than Down Over Next Six Months

December 14, 2025
Sangha Energizes 20 MW Texas Solar Bitcoin Mine Amid Record-Low Hashprice Pressure

Sangha Energizes 20 MW Texas Solar Bitcoin Mine Amid Record-Low Hashprice Pressure

December 14, 2025
Tags: 88DayAppearsATHBitcoinbitcoin newsBullishChartcrypto analysiscrypto newsEthoz EdgeEXTREMELYHittingLatest bitcoin newslatest crypto newsPriceStructure
Share76Tweet47

Related Posts

Here Are The Reasons Why XRP’s Technical Structure Favors Upside Than Down Over Next Six Months

Here Are The Reasons Why XRP’s Technical Structure Favors Upside Than Down Over Next Six Months

by IMPACTCRYPTO
December 14, 2025
0

XRP’s recent pullback to $2 has not changed the broader technical picture, according to a new analysis shared on X...

Sangha Energizes 20 MW Texas Solar Bitcoin Mine Amid Record-Low Hashprice Pressure

Sangha Energizes 20 MW Texas Solar Bitcoin Mine Amid Record-Low Hashprice Pressure

by IMPACTCRYPTO
December 14, 2025
0

Sangha Renewables has energized a 20-megawatt bitcoin mining facility in West Texas, marking the company’s latest effort to pair renewable...

Bitcoin To Retest ,000 Mark In Coming Days

Bitcoin To Retest $85,000 Mark In Coming Days

by IMPACTCRYPTO
December 14, 2025
0

Trusted Editorial content, reviewed by leading industry experts and seasoned editors. Ad Disclosure Amid a steady price rebound in the...

Bitcoin Macro Retracement Meets Mid-Range Battle

Bitcoin Macro Retracement Meets Mid-Range Battle

by IMPACTCRYPTO
December 13, 2025
0

Bitcoin is facing a critical juncture as its macro retracement converges with a tight mid-range battle between $86,000 and $100,000....

What is a Bitcoin ATM? How to Buy and Sell BTC with Cash

What is a Bitcoin ATM? How to Buy and Sell BTC with Cash

by IMPACTCRYPTO
December 13, 2025
0

Last Updated: Dec. 13, 2025 A Bitcoin ATM (sometimes called a BTM) is a physical kiosk that allows you to...

Load More

Welcome Back!

Login to your account below

Forgotten Password?

Retrieve your password

Please enter your username or email address to reset your password.

Log In
Please enter CoinGecko Free Api Key to get this plugin works.
No Result
View All Result
  • Home
  • DeFi News
  • EVM News
    • Avalanche Network
    • Ethereum
    • Fantom Opera Chain
    • Harmony Chain
    • Huobi Eco Chain
    • Polkadot Chain
    • Polygon Chain
  • NFT News
  • Altcoin News
  • Crypto News
    • Crypto Regulation News
    • Bitcoin
    • Blockchain
    • Crypto Exchanges
    • Crypto Mining
    • Metaverse
    • Scam News
    • Web 3.0

© 2018 JNews by Jegtheme.